If you are trying to work out whether smartphone gaming benchmark numbers mean anything, here is the direct answer: they measure a phone’s short-term ceiling far better than they measure the experience you will actually have. A benchmark run is typically a few minutes long on a cool device. A gaming session is forty minutes long on a device that is already warm from being in your pocket. The gap between those two conditions is where almost all of the interesting engineering lives, and it is the reason two phones with nearly identical headline scores can feel completely different to play on.
I am Owen Pritchard, and I have spent twelve years as a technical guides editor working from a diagnostics bench built around POST cards, swap-test spare parts and a shelf of prepared OS images. Most of that bench is aimed at desktops, but the diagnostic habit transfers cleanly: never trust a single number, always change one variable at a time, and always ask what the test was physically capable of measuring. That framing is what this article applies to phone benchmarks. Nothing here is trying to sell you a specific handset. The goal is to make the charts readable so you can judge them yourself.
As an Amazon Associate we earn from qualifying purchases at no extra cost to you. Product prices and availability are accurate as of the date shown and are subject to change.






Top 3 picks at a glance
What a smartphone gaming benchmark is physically doing
A graphics benchmark renders a fixed scene, or sequence of scenes, using the phone’s GPU and reports how fast it finished. The scene is fixed so that the workload is identical between devices, which is the only way a cross-device comparison is meaningful. The output is usually expressed as a score, a frame rate, or both. Some tests target the GPU almost exclusively. Others deliberately mix in physics, draw-call submission and CPU-side scene setup so the result reflects the whole system rather than one block of silicon.
CPU benchmarks work the same way with different code: fixed integer and floating-point workloads, sometimes single-threaded, sometimes spread across every core. Storage benchmarks push sequential and random reads and writes at defined queue depths. Each one isolates a subsystem. None of them, on their own, describes a game.
The important limitation is duration. A typical graphics run takes between one and five minutes. Silicon heats up in seconds, but the phone’s chassis, mid-frame and glass back take several minutes to reach a steady temperature. A short test finishes before the chassis has saturated, so it captures the device in a condition you will almost never be in while actually playing.
Peak score versus sustained score
The single most useful thing you can do with benchmark data is stop looking at the peak number and start looking at the sustained one. Stress-test modes exist for exactly this reason: they run the same graphics loop back to back, typically twenty times over roughly twenty minutes, and report both the best loop and the worst loop.
The ratio between those two is usually called stability. A phone that scores 4,200 on its best loop and 3,600 on its worst has a stability figure around 86 percent. A phone that scores 5,400 on its best loop and 2,700 on its worst is at 50 percent, and its worst loop is meaningfully slower than the first phone’s worst loop, despite winning the headline comparison by a wide margin.
That second phone will produce better screenshots of benchmark results and a worse forty-minute session. It is a very common pattern, particularly on thin flagship designs where the marketing budget went into the chip and the industrial design budget went into thinness.
| Metric | What it captures | How much it predicts real gaming |
|---|---|---|
| Peak GPU score | Best-case burst throughput on a cool device | Low to moderate |
| Worst-loop score | Throughput after the chassis is heat-saturated | High |
| Stability percentage | How much performance is lost to heat | High |
| Single-core CPU score | Engine logic, draw-call submission, load times | Moderate |
| Storage random read | Asset streaming and level load times | Moderate |
| Peak brightness in nits | Outdoor legibility, not speed | None for frame rate |
The four hardware systems that decide phone gaming performance
Only four things really move the needle, and it helps to hold them separately in your head rather than collapsing them into one word like “power”.
The system-on-chip. CPU cores, GPU cores, memory controller and image processor share one die. The GPU sets the ceiling on shading and fill rate. The CPU cores handle game logic, physics and the work of preparing frames for the GPU. On mobile the CPU is a more common bottleneck than people expect, because mobile game engines are often single-thread heavy on their main render thread.
Memory bandwidth and capacity. Mobile chips share one pool of memory between CPU and GPU. Bandwidth matters at high resolutions because every pixel written and read consumes it. Capacity matters differently: past the point where the game plus the operating system fit, more capacity stops raising frame rates and starts helping with app switching only.
The thermal stack. Vapour chambers, graphite sheets, thermal interface material and the mass of the frame. This is the least glamorous component list on the spec sheet and the one that changes the sustained result most. There are no fans inside a normal phone, so every watt the chip burns has to reach the outer surfaces by conduction and leave by radiation and convection from a body that must stay comfortable against skin.
The display and its controller. A 120 Hz panel only helps if the chip can feed it, and a variable refresh panel that drops to a low refresh floor while a game runs at an awkward intermediate frame rate can look worse than a fixed 60 Hz panel. Touch sampling rate, which is how often the digitiser reports finger position, is a separate specification from refresh rate and contributes to how responsive a shooter feels.
How throttling shows up in the data
Throttling is not a single event. It is a curve, and the shape of the curve tells you what kind of thermal design you are dealing with.
A phone with generous heat spreading and a conservative power policy shows a shallow, gradual decline: loop one at 100 percent, loop five at 92, loop ten at 85, and then a flat line for the remaining loops. That flat line is the important part. It means the device found an equilibrium it can hold indefinitely, and a game tuned to that equilibrium will run consistently.
A phone with an aggressive boost policy and limited heat spreading shows a cliff: loops one and two are spectacular, loop three falls off sharply, and loops four through twenty oscillate as the controller repeatedly boosts and backs off. Oscillation is worse than a low flat line, because the frame rate changes are visible and the game’s own dynamic resolution scaling starts fighting the thermal controller.
Ambient temperature moves all of this. Testing at 20 degrees Celsius in a still room produces meaningfully different numbers from testing at 30 degrees, and a phone that is 88 percent stable in a cool room can drop into the sixties on a warm day. Any chart without a stated ambient temperature is missing a variable that changes the conclusion.
Synthetic tests versus in-game frame logging
Synthetic tests solve a real problem. Games patch, servers change, and the exact scene you record is never quite reproducible, so cross-device comparison based purely on gameplay is noisy. A fixed synthetic workload removes that noise entirely.
The cost is representativeness. Synthetic scenes are written to stress the GPU in predictable, evenly distributed ways. Real games have wildly uneven frame costs: a quiet corridor renders in six milliseconds, then a smoke grenade, four particle systems and a shader that has never been compiled on this device all land in the same frame and it takes forty. Synthetic tests almost never reproduce that pattern.
In-game frame logging captures it. The methodology is straightforward: pick a repeatable route through a level, run it several times, log per-frame times rather than averages, and report the distribution. The numbers that matter from that log are the median frame time, the 1 percent low, and the count of frames that took more than double the median. That last figure is the closest single number to “how often did it visibly hitch”.
Reading a benchmark chart without being fooled
Six questions handle most of the misleading charts you will encounter.
Was the device cool at the start? A phone taken off a charger is warm from charging. A benchmark started immediately afterwards produces a lower score than the same phone after twenty minutes of rest, and a reviewer who charges one device and not another has introduced a variable larger than most generational gaps.
What resolution was rendered? Offscreen tests render at a fixed internal resolution regardless of the panel, which makes chips comparable. Onscreen tests render at the panel’s native resolution, which makes devices comparable. Mixing the two in one chart is meaningless, and it happens often.
Was a performance mode enabled? Many phones ship a high-performance toggle that raises thermal limits and lets the chassis get hotter. Results with that mode on are legitimate but are not comparable to results from a phone tested in its default profile.
How many runs, and is the spread published? One run is an anecdote. Three runs with the spread shown is data.
Is the vertical axis truncated? A bar chart starting at 3,000 instead of zero turns a 6 percent difference into a bar that looks twice as tall.
Is the phone in a case? A thick case is a thermal insulator and can cost a noticeable share of sustained performance. Most people play with a case on. Most benchmarks are run without one.
Frame pacing and why averages hide the problem
An average frame rate of 60 can describe a perfectly smooth experience or a genuinely unpleasant one. If every frame takes 16.7 milliseconds, it is smooth. If frames alternate between 8 and 25 milliseconds, the average is still around 60 but the motion judders visibly, because your eye tracks the inconsistency rather than the mean.
This is why frame time graphs are more informative than frame rate counters. A frame time graph plots the cost of every individual frame as a line. Smooth output is a flat line. Poor pacing is a sawtooth. Shader compilation stalls are isolated spikes that shoot far above the baseline and then settle.
Mobile has a particular version of this problem: the operating system can migrate a game’s render thread between a performance core and an efficiency core mid-session, usually as a thermal or battery response. That migration can double a frame’s cost for a handful of frames. It is invisible in an average and obvious in a frame time log. Desktop players will recognise the same underlying category of problem from their own systems, and the diagnostic logic in my guide on how to fix fps drops in games maps across almost unchanged.
Display refresh, touch sampling and perceived speed
Two phones running a game at an identical 60 fps can feel different to play, and the difference is usually input latency rather than rendering.
Touch sampling rate is how often the digitiser polls your finger. A 120 Hz sampling rate reports position every 8.3 milliseconds; a 240 Hz sampling rate halves that. On top of the sampling interval you have the game’s own input processing, one or more frames of render latency, and the display’s response time. Those add up to something in the range of 50 to 120 milliseconds on typical devices, and the spread between a well-tuned phone and a poorly tuned one is large enough to feel in a shooter.
Refresh rate interacts with this in a way that is easy to get wrong. A 144 Hz panel does nothing for a game locked at 60 fps except reduce the time a finished frame waits to be shown, which is a real but modest benefit. If the game supports a high frame rate mode and the chip can sustain it, the panel matters a lot. If it cannot, the panel is mostly marketing.
Power draw as a performance metric
The most underrated column in any phone gaming test is watts. Two devices producing 60 fps in the same scene are not equivalent if one draws 4.5 watts and the other draws 7.5. The efficient one will hold that frame rate longer, get hotter more slowly, and drain the battery at roughly half the rate.
Efficiency is measured as frames per watt, and it is the metric that best predicts sustained behaviour, because sustained performance is fundamentally a thermal problem and thermal load is just power. A chip that is 30 percent more efficient at the same frame rate has, in practical terms, 30 percent more thermal headroom before it has to start cutting clocks.
This is also why battery percentage per hour of gameplay belongs in any serious test. A phone that loses 18 percent per hour in a demanding title and one that loses 32 percent are describing very different devices, even if their frame rate charts are within a few percent of each other.
How I structure a test pass
The method I use on the bench for desktops adapts directly. Control the environment first: fixed ambient temperature, no direct sunlight, no charger connected, airplane mode off but notifications silenced, screen brightness pinned to a fixed value rather than automatic, and a minimum twenty-minute idle before the first run so the chassis is at a known starting point.
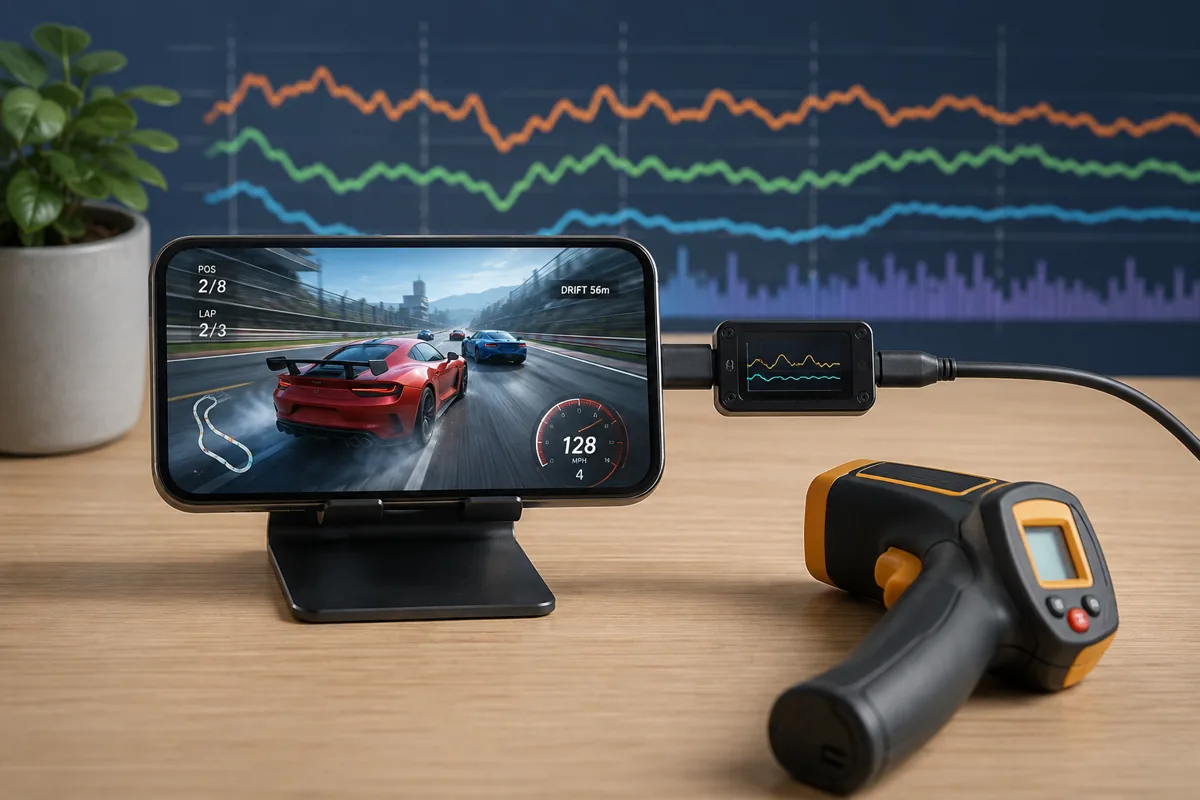
Then run in a fixed order. A short synthetic burst first to capture the peak. A twenty-loop stress run next to capture the decline curve and the equilibrium. A thirty-minute session in an actual game with per-frame logging third. Battery percentage recorded at the start and end of the game session. Surface temperature measured with an infrared thermometer at three fixed points: the camera bump, the centre of the back, and the lower third of the screen.
Finally, repeat the whole sequence on a different day. Phones update their firmware, background processes vary, and thermal paste and adhesive behaviour shifts slightly with the device’s history. A result that does not reproduce on a second day is not a result.
Where benchmark numbers stop being useful
There are questions the entire category cannot answer, and it is worth naming them so you do not go looking for a number that does not exist.
Benchmarks cannot tell you whether a game is well optimised for a specific chip. Vendor-specific driver work, texture compression choices and shader precompilation vary per title, and a phone that dominates synthetic charts can run a particular game worse than a rival because the developer optimised for the rival’s architecture.
They cannot tell you how the device will behave in eighteen months, after a battery has aged and thermal interface material has degraded slightly. They cannot tell you whether the manufacturer’s software will keep aggressively killing background apps. They cannot tell you whether a controller pairs cleanly, whether the game supports the panel’s refresh rate at all, or whether the touch layer has dead zones near the bezel where your thumbs sit.
For anyone whose main interest is playing demanding titles rather than owning the fastest handset, the honest answer is often that streaming sidesteps the whole thermal argument, since the rendering happens elsewhere and the phone becomes a display with a network connection. I have covered the trade-offs of that approach separately in the overview of the best cloud gaming services, and the decision framework there is genuinely different from the one on this page.
Common mistakes buyers make with benchmark data
Four errors account for most bad purchases.
The first is comparing scores across benchmark versions. Test suites update their scenes and scoring, and a score from an older version is not comparable to a newer one even though both are printed as a single number with no version label attached.
The second is treating CPU scores as gaming scores. A high multi-core figure reflects a chip with many cores and good sustained multi-threaded throughput. Most mobile games do not scale across many cores, so that figure predicts video export times better than frame rates.
The third is ignoring the display resolution in the comparison. A phone rendering at a higher native resolution is doing meaningfully more work per frame, and comparing its onscreen result to a lower-resolution device’s onscreen result without acknowledging that is comparing two different workloads.
The fourth, and the most consequential, is buying on peak numbers when your actual use case is long sessions. If you play for ten minutes at a time on a commute, peak performance is a reasonable proxy. If you play for an hour, the worst-loop number is the only one that describes your experience, and the ranking built from worst-loop scores frequently reorders the ranking built from peaks.
How large is a generational gap, really
Chip vendors typically claim GPU improvements somewhere in the 15 to 30 percent range from one generation to the next, occasionally higher when a manufacturing node changes. Those figures are usually measured at peak, on a reference board with cooling that no shipping phone has. The number that reaches you is smaller.
Work through the arithmetic. Suppose a new chip is genuinely 25 percent faster at peak and 20 percent more efficient at equal performance. In a thin chassis that could only dissipate around 4 watts before, the efficiency gain lets it hold a slightly higher clock at the same 4 watt budget, so the sustained improvement lands closer to 12 to 18 percent rather than 25. In a heavier chassis with a larger vapour chamber that can shed 6 watts, more of the theoretical gain survives, and you might see 20 percent sustained.
That is why chassis design frequently outweighs chip generation in sustained results, and why a previous-generation chip in a thick device with proper heat spreading can outrun a current-generation chip in a very thin one. It also explains a pattern that confuses buyers: the same silicon in two different phones can differ by 20 percent or more on a worst-loop measurement, which is a larger gap than the one between chip generations.
Practically, this means a one-generation upgrade is rarely worth it on performance grounds alone. Two generations usually is, particularly if the older device has an aged battery, since a battery with degraded internal resistance sags under load and can trigger protective clock reductions that look exactly like thermal throttling in a log but are not.
Bench discipline that transfers from desktop to phone
Three habits from desktop diagnostics carry over completely, and they are the difference between data and impressions.
Change one variable at a time. If you enable a performance mode, remove the case, and update the firmware before your second run, you have three candidate explanations for the change and no way to separate them. On a desktop bench I would swap one stick of memory and retest; the phone equivalent is one setting per pass.
Record the conditions, not just the result. Ambient temperature, starting battery percentage, brightness level, whether the charger was connected, whether a case was fitted, and how long the device rested beforehand. A result without conditions cannot be reproduced, and a result that cannot be reproduced is an anecdote.
Test the failure mode, not just the happy path. The interesting question is not what the phone does in loop one. It is what it does in loop fifteen, in a warm room, with the screen at full brightness and a case on, because that combination is closer to a real session than anything a clean lab run produces.
The bottom line
Smartphone gaming benchmarks are useful instruments used badly. They measure exactly what they claim to measure, which is throughput on a fixed workload over a short window, and the mistake is not in the tests but in reading a short-window number as if it described a long session.
If you take three things from this: read the worst loop rather than the best, treat stability percentage as the headline figure it deserves to be, and check whether the reviewer stated ambient temperature and case status. Those three habits will filter out most of the noise in phone gaming coverage and leave you with charts that actually correspond to what you will feel with the device in your hands.
The landscape is not one where a single chip wins. It is one where thermal engineering, software power policy, display behaviour and per-title optimisation combine into a result that no single score captures. Once you stop expecting one number to summarise all of that, the data becomes considerably more useful.